

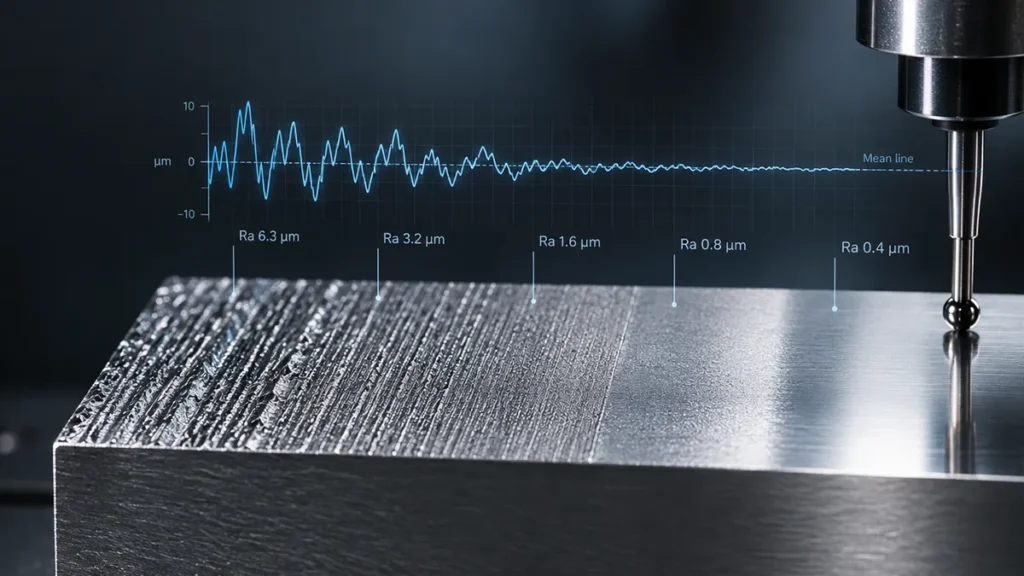
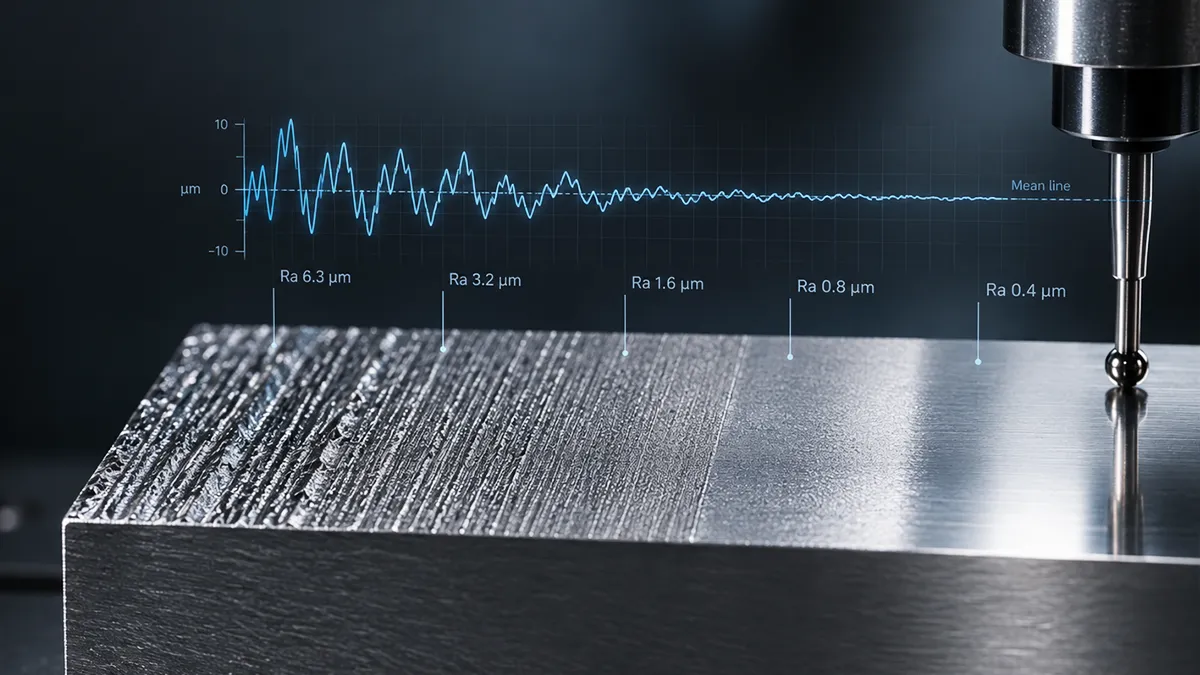
A rugosidade da superfície é uma das características mais importantes das peças maquinadas. Afeta diretamente o desempenho, o atrito, o desgaste, a estanqueidade, o aspeto e até mesmo o custo de fabrico.
Um dos parâmetros de rugosidade mais frequentemente especificados nos desenhos de engenharia é a rugosidade média aritmética (Ra). O Ra fornece uma indicação repetível e normalizada da textura média da superfície. No entanto, em alguns casos, o Ra precisa de ser combinado com outras normas de rugosidade, tais como o Rz e o Rpk. Esta combinação é importante quando se trata de superfícies funcionais, como implantes médicos, munhões de rolamentos e faces de vedação.
Este guia analisa em pormenor a rugosidade da superfície e os valores Ra. O guia explica o significado dos valores Ra, como medi-los e como especificar corretamente a rugosidade nos desenhos de engenharia.
O que é a rugosidade da superfície?
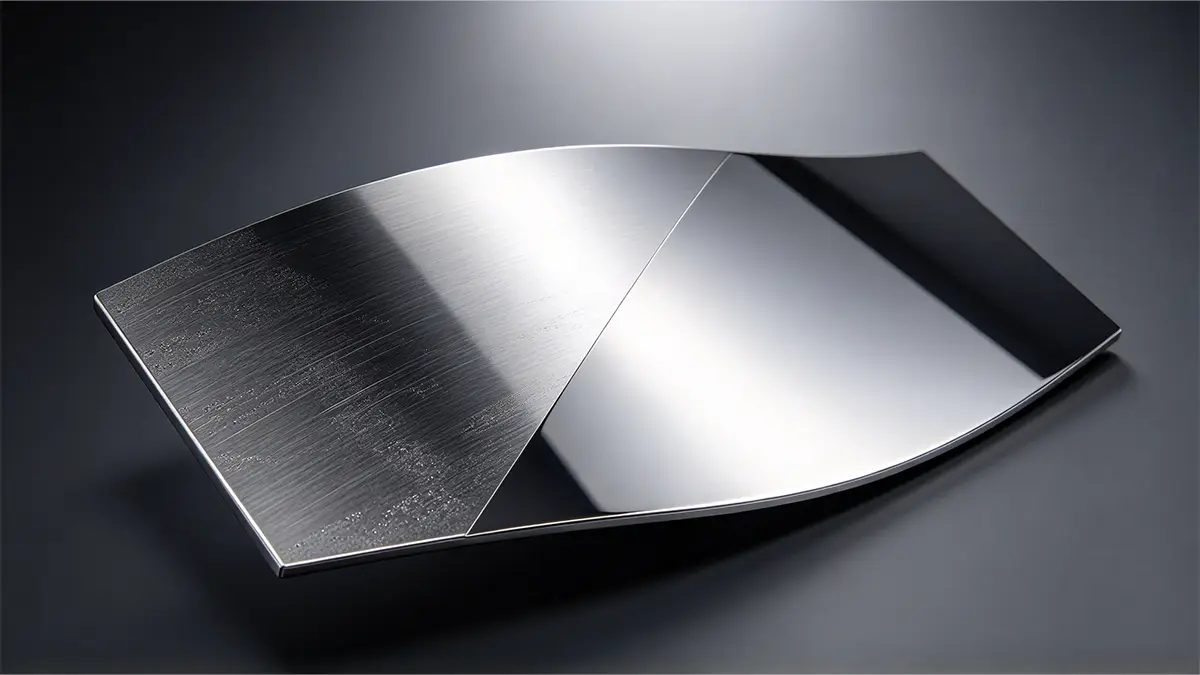
A rugosidade da superfície descreve as irregularidades microscópicas que ficam na superfície após a maquinação. Estas irregularidades resultam do movimento da ferramenta de corte, da geometria da ferramenta, das propriedades do material e dos parâmetros de maquinação, tais como a velocidade de avanço e a velocidade de corte. A rugosidade da superfície faz parte da descrição da textura da superfície. A textura da superfície inclui a rugosidade, que consiste em marcas finas de maquinagem com profundidade entre 0,1 e 100 µm. Outros componentes da textura da superfície incluem a ondulação, a orientação e o erro de forma, que são definidos e regulamentados de forma abrangente no âmbito de quadros de metrologia normalizados, como a Norma ASME B46.1 «Especificação de Textura da Superfície». [1].
A rugosidade da superfície é uma escala numérica da textura da superfície, ao contrário de outras irregularidades, como mate e prateado ou liso e brilhante. A rugosidade não se limita a ser sentida ou vista; também pode ser medida. A rugosidade superficial pode ser gerada intencionalmente pelos sistemas de fabrico ou resultar de vários fatores. Esses fatores incluem as propriedades físicas do material e as vibrações das ferramentas de corte. A rugosidade superficial é estudada no domínio da metrologia de superfícies.
Por que razão a rugosidade da superfície é importante?
É impossível obter uma superfície perfeita. No entanto, existem níveis de perfeição a atingir para garantir a eficácia das operações de fabrico. A quantificação da rugosidade da superfície é relevante para produtos comerciais que exigem um controlo rigoroso dos custos e que são concebidos para tempos de ciclo curtos. A produção de engenharia estabelece limites de desvio aceitáveis para diferentes conjuntos de produtos. A medição da rugosidade superficial contribui para o controlo de qualidade. Além disso, os engenheiros podem utilizar o quadro de rugosidade definido para cumprir especificações estéticas. Isto ajuda a classificar os produtos em diferentes categorias, cada uma com um preço diferente.
Como se mede a rugosidade da superfície?
A rugosidade da superfície é um valor médio. Consiste na quantificação dos desvios nos picos, vales e irregularidades observados na superfície da peça, tomando como referência um padrão ideal. O termo mais utilizado na medição da rugosidade da superfície é a rugosidade média aritmética (Ra). No entanto, outros parâmetros, como Rz, Rt, Rq e Rmax, são comuns.
Rz é a média dos picos mais altos e dos vales mais baixos consecutivos. Normalmente, isto é feito para os cinco maiores desvios e, em seguida, calcula-se uma média. Rp é a distância calculada entre o pico mais alto do perfil e a linha média no comprimento de avaliação. Rv é a distância calculada entre o ponto mais baixo do perfil e a linha média no comprimento de avaliação. Rmáximo é o maior desvio consecutivo entre o pico mais alto e o vale mais baixo, calculado no intervalo de avaliação.
| Parâmetro | Significado | Utilização típica |
|---|---|---|
| Rₐ | Desvio absoluto médio em relação à linha média | Especificações gerais relativas às superfícies |
| Rq | Rugosidade quadrática média | Análise de precisão de superfícies |
| Rz | Altura média entre o pico e o vale ao longo dos comprimentos de amostragem | Superfícies de maquinagem e funcionais |
| Rt | Altura máxima entre o pico e o vale ao longo do comprimento de avaliação | Detecção de defeitos graves |
| Rp | Altura máxima do pico do perfil | Análise de picos |
| Rv | Profundidade máxima do vale do perfil | Análise do vale |
Cálculo dos valores de Ra
Ra é a média do desvio dos vales e picos da superfície em relação à linha de referência. Pode ser expressa da seguinte forma:;
Ra = (|y1| + |y2| + |y3| + … + |yn|) / n
Onde y é o desvio de cada ponto medido em relação à linha média e n é o número de pontos medidos. O Ra é normalmente medido em micrómetros (µm).
Os engenheiros não fazem uma avaliação absoluta sobre a natureza da rugosidade da superfície com base na determinação dos valores Ra. As superfícies podem apresentar os mesmos valores Ra, mas padrões diferentes de picos e vales. Essas superfícies podem comportar-se de forma diferente em aplicações relacionadas com desgaste, atrito e vedação.
A rugosidade da superfície pode ser determinada através de métodos com contacto ou sem contacto.
O que é o método de contacto para determinar a rugosidade da superfície?
O método mais comum para estimar a rugosidade da superfície consiste na utilização de um perfilómetro de contacto.
A ferramenta possui uma agulha com ponta de diamante que estabelece contacto físico com a superfície. O ponto de contacto desliza pela superfície ao longo de uma distância especificada, registando o perfil da superfície. O ponto de contacto desloca-se para cima quando encontra um pico e para baixo quando encontra um vale. O instrumento dispõe de um sistema de deteção que capta estes movimentos e os converte em sinais elétricos. O sinal elétrico é processado para criar um perfil da superfície, que é depois interpretado no laboratório sob a forma de curvas. O perfilómetro de contacto funciona com um software que separa a rugosidade das variações da superfície com comprimentos de onda mais longos. O software calcula parâmetros como o Ra e o Rz e apresenta os resultados em valores numéricos.
Superfície → Agulha de diamante → Movimento vertical da agulha → Sinal elétrico → Perfil → Filtragem → Cálculo da rugosidade → Ra/Rz
Quais são os métodos de medição sem contacto da rugosidade da superfície?
Esta abordagem de medição utiliza a luz para medir a textura microscópica. Ao contrário de um estilete físico que traça mecanicamente picos e vales, a abordagem sem contacto capta a interação da luz com a superfície, criando um perfil 2D. Este método é amplamente utilizado quando os engenheiros precisam de evitar riscos ou deformações nos componentes, quando os métodos tradicionais não conseguem alcançar estruturas profundas e quando o estilete de contacto danifica um revestimento delicado. Os sistemas óticos sem contacto podem produzir mapas de superfície 3D para facilitar a análise por parte dos engenheiros. Os engenheiros podem ver onde ocorrem picos e vales específicos, marcas de maquinagem e riscos. Alguns dos métodos de medição de superfícies sem contacto incluem a interferometria de luz branca (WLI), a microscopia confocal, a digitalização a laser e a perfilometria ótica.
A WLI utiliza a interferência de ondas de luz para estimar diferenças de altura da superfície extremamente pequenas, fornecendo uma topografia quantitativa da superfície de alta resolução e mapas de altura 3D detalhados sem contacto físico, tal como destacado nos Relatórios de Análise de Materiais da Lucideon [2].
Na digitalização a laser, um feixe de laser focado é projetado sobre a superfície da peça e a luz refletida é medida através de métodos como a triangulação a laser. Dependendo da altura da superfície, a posição do feixe de laser refletido altera-se, e essas alterações de posição são convertidas em medições de altura. O feixe de laser é deslocado ao longo da superfície da peça, gerando um perfil da superfície.
Como escolher a rugosidade de superfície adequada?
A escolha do acabamento de uma superfície deve partir da função da peça, e não do valor de rugosidade mais baixo possível. Cada superfície maquinada tem uma finalidade diferente, pelo que o acabamento deve corresponder à aplicação em questão, em vez de se aplicar o mesmo requisito a todo o componente.
Adaptação da rugosidade da superfície aos requisitos funcionais
Os engenheiros procuram adaptar a função de rugosidade superficial ao produto em utilização. Determinam como a peça será utilizada após a maquinagem antes de escolherem o acabamento superficial. Se o acabamento superficial não cumprir os requisitos funcionais da peça, são aplicados acabamentos mais finos, especialmente nos assentos dos rolamentos, nas superfícies de deslizamento, nos encaixes de precisão e nas faces de vedação. Se as superfícies não afetarem a montagem, os fabricantes aplicam acabamentos de maquinagem padrão para redefinir a rugosidade superficial. Os valores de rugosidade superficial são atribuídos apenas às superfícies que apresentam um requisito funcional.
Equilibrar o acabamento da superfície com os custos de fabrico
Para obter valores de rugosidade mais baixos, os fabricantes recorrem a operações adicionais de maquinagem ou acabamento. Estas operações incluem polimento, retificação, afiação e outras passagens de acabamento adicionais. Estes processos de fabrico e métodos de acabamento adicionais afetam os custos globais de fabrico. Por conseguinte, recomenda-se aos engenheiros que utilizem acabamentos mais finos apenas quando estes proporcionem benefícios funcionais. Nesses casos, pode recorrer-se à maquinagem padrão.
Evitar uma especificação excessiva do acabamento superficial
Outra estratégia para escolher a rugosidade superficial adequada consiste em evitar atribuir o mesmo acabamento superficial a todas as faces da peça. A aplicação de requisitos de acabamento rigorosos em áreas não funcionais aumenta o tempo de maquinagem e o trabalho de inspeção. Os fabricantes devem analisar cada superfície individualmente durante a conceção da peça. Limitar os acabamentos finos às características críticas simplifica o processo de fabrico, mantendo simultaneamente a qualidade exigida para a peça.
Conclusão
O acabamento superficial mede os pequenos picos e vales que ficam numa peça maquinada. O Ra (rugosidade média) é a média aritmética das alturas do perfil — a indicação mais comum nos desenhos de engenharia. O Rz é a altura média entre o pico e o vale ao longo de um comprimento de amostragem e é mais sensível a riscos profundos.
Os requisitos relativos ao acabamento da superfície variam de uma peça para outra. Uma caixa, um eixo, uma superfície de vedação e um componente ótico raramente apresentam o mesmo valor de Ra, uma vez que cada superfície desempenha uma função diferente. Durante a conceção, os engenheiros especificam a rugosidade apenas para as áreas que influenciam a montagem, o movimento, a vedação, o revestimento, a inspeção e a qualidade do produto.
Referência
[1] Sociedade Americana de Engenheiros Mecânicos (ASME). (2019). B46.1-2019 Textura da superfície (rugosidade, ondulação e orientação da superfície). Normas da ASME. https://www.asme.org/getmedia/f22128e5-acad-429d-bc75-0ac4bdffdf44/b46-1-2019-11×17-poster.pdf
[2] Lucideon. (s.d.). Interferometria de Luz Branca – WLI para a topografia quantitativa de superfícies. Testes e Caracterização da Lucideon. https://www.lucideon.com/testing-characterisation/particulate-analysis/white-light-interferometry-wli







 PT
PT  EN
EN  ES
ES  FR
FR  DE
DE  IT
IT  NL
NL  PL
PL  AR
AR  JA
JA  KO
KO  ZH
ZH