In our last article on Design for Manufacturing (DFM) in injection molds, we explored the important role of DFM between the injection mold or molding plant and the customer. As a natural progression, we now delve into another powerful tool in the arsenal of mold designers: mold flow analysis. Mold flow analysis is an advanced simulation technique that complements DFM principles and enables designers to gain invaluable insights into the behavior of molten plastic during the injection molding process.
What Is Mold Flow Analysis?
Mold flow analysis is a process that utilizes CAE software (such as Moldflow, C-Mold, Z-Mold, etc.) to conduct finite element simulation of the injection, holding pressure, cooling, and warping processes of plastic parts.
Mold flow analysis can effectively predict the problems that molds may encounter in actual production, such as insufficient filling, weld lines, and warping deformation, thereby optimizing the mold design stage to avoid production issues. Additionally, mold flow analysis can also provide a theoretical basis for optimizing mold design and improving production processes.
The Relationship Between Mold Flow Analysis and DFM
DFM (Design for Manufacture) is a design approach focused on manufacturing, which requires considering the feasibility and cost-effectiveness of manufacturing at the early stages of product design. DFM covers the entire product development process, including conceptual design, detailed design, process planning, and production manufacturing stages.
In plastic product manufacturing (including automotive, aerospace, medical, equipment, consumer goods, electronics, personal care, and most other industries), the application of DFM in mold design is also crucial. Through DFM, designers can evaluate and optimize product designs to make them easier to manufacture. This includes assessing manufacturability, determining the optimal manufacturing methods, and optimizing product designs to reduce manufacturing difficulty and cost.
In summary, mold flow analysis and DFM are both important tools in mold design and manufacturing in the automotive manufacturing industry. They complement each other and can effectively improve the quality and production efficiency of molds while reducing production costs.
The Basic Process of Mold Flow Analysis
I. Mesh Generation
Supported File Formats
Mold flow analysis software supports reading 3D file formats from mainstream CAD software, such as *.igs, *.stp, *.x_t, *.prt, *.jt, *.catpart, and other mesh formats produced by finite element software, such as *.stl, *.bdf, *.nas.
Mesh Quality Control
When generating meshes, it’s necessary to control the mesh quality to meet the analysis requirements.
II. Material Selection
Types of Materials
Most mold flow analysis software includes thousands of materials in their databases for user selection, including thermoplastics, thermosetting plastics, metals, cooling media, etc.
Material Models
Mold flow analysis is based on theoretical sciences such as polymer rheology, heat transfer, crystallization kinetics, and material mechanics. Material property models are essential input data for analysis.
For conventional injection molding, commonly used material models mainly include viscosity models, PVT models, and crystallization kinetics models, and factors such as specific heat capacity, thermal conductivity, and mechanical properties are critical factors affecting the model.
III. Process Settings
Currently, most mold flow analysis software’s process controls are divided into CAE mode and injection molding machine mode.
CAE mode is mainly used for preliminary evaluation without considering the influence of the injection molding machine. Injection molding machine mode is mainly used for later validation, allowing the process to be set according to the actual machine’s injection method.
1. Filling Settings
(1) CAE Mode
A. Filling Time
Set the time required for product filling, and during analysis, convert it into a flow rate as the initial condition for solving. When creating a new process, Moldex3D automatically recommends a suitable filling time based on the product volume and molding material.
B. Multi-stage
Flow Rate Setting For large products with complex structures and long flows, segmented injection molding is often used to achieve uniform flow front velocities.
C. Multi-stage Pressure Setting
Pressure refers to the pressure required to overcome the flow resistance of the melt, which, for actual molding, refers to the pressure exerted by the injection screw on the melt.
D. V/P Switching
During the product filling stage, flow front advancement is usually controlled by injection speed. When the product is about to complete filling (95%~99% volume), to prevent overfilling and flash due to excessive injection pressure, the control needs to be switched from speed control to pressure control.
(2) Injection Molding Machine Mode
A. Multi-stage Flow Rate Setting
The injection molding machine mode allows users to simulate analysis with actual production process parameters or output suitable process parameters to the production department for trial production.
B. Multi-stage Pressure Setting
The pressure of the injection molding machine refers to the pressure exerted by the screw on the melt, providing the power for the melt to advance.
C. V/P Switching
Most injection molding machines’ VP control directly sets the switching position for switching.
2. Packing Settings
The purpose of packing is to compensate for the amount of melt in the cavity that has not been completely filled during the filling stage and the amount of shrinkage after filling. Packing parameter settings usually include segmented curves of packing pressure and packing time.
3. Cooling Settings
(1) Cooling Time
The cooling time of injection molding mainly depends on the thickness of the plastic part and is also related to factors such as the melt temperature, mold temperature, and thermal conductivity of the mold steel.
Commonly used empirical formulas for estimating cooling time are as follows:

tc is the cooling time, representing the time required for the average temperature in the thickness direction of the plastic part to cool to the ejection temperature TE; TM is the melt molding temperature; Tc is the mold temperature; H is the thickness of the plastic part; α is the thermal diffusion coefficient of the plastic.
(2) Cooling Liquid Settings
To remove the heat introduced by each shot of plastic within the cooling time, it is necessary to estimate whether the coolant flow rate is sufficient to complete a certain amount of heat exchange in a fixed time. At the same time, to achieve better product appearance quality, it is necessary to control the uniform distribution of mold surface temperatures within a certain range.
IV. Report Generation
Since mold flow analysis is based on theoretical numerical analysis, most of the output results are data values. To facilitate result interpretation and communication between departments, the results need to be presented in a PPT report. The report should cover product information, mesh information, material information, process information, result interpretation, etc.
How To Understand A Mold Flow Analysis Report
Now, we will review a mold flow analysis report for an automotive part, providing valuable insights on key aspects to consider during mold flow analysis. This case study will serve as a practical guide to understanding and interpreting mold flow analysis reports effectively.
Please note that the images in this case have been mosaicked for some confidential purposes
Basic Information
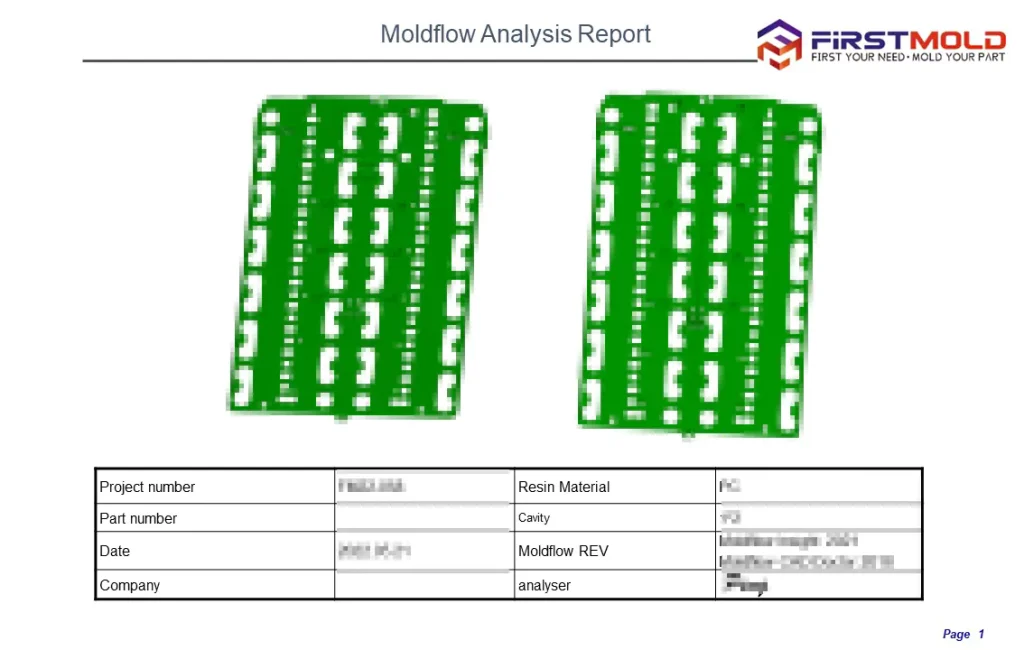
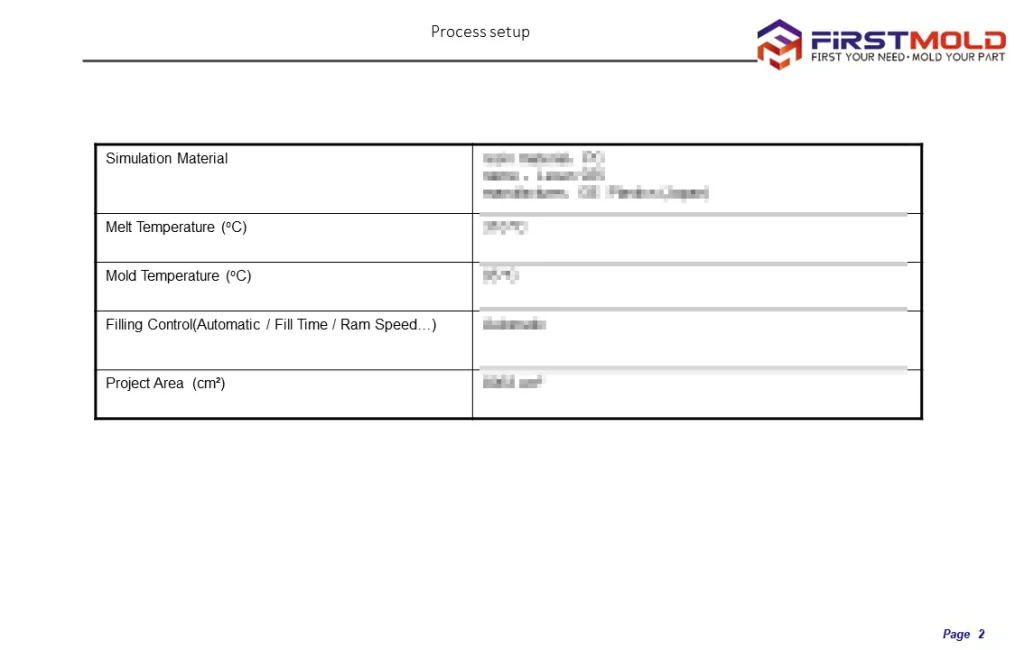
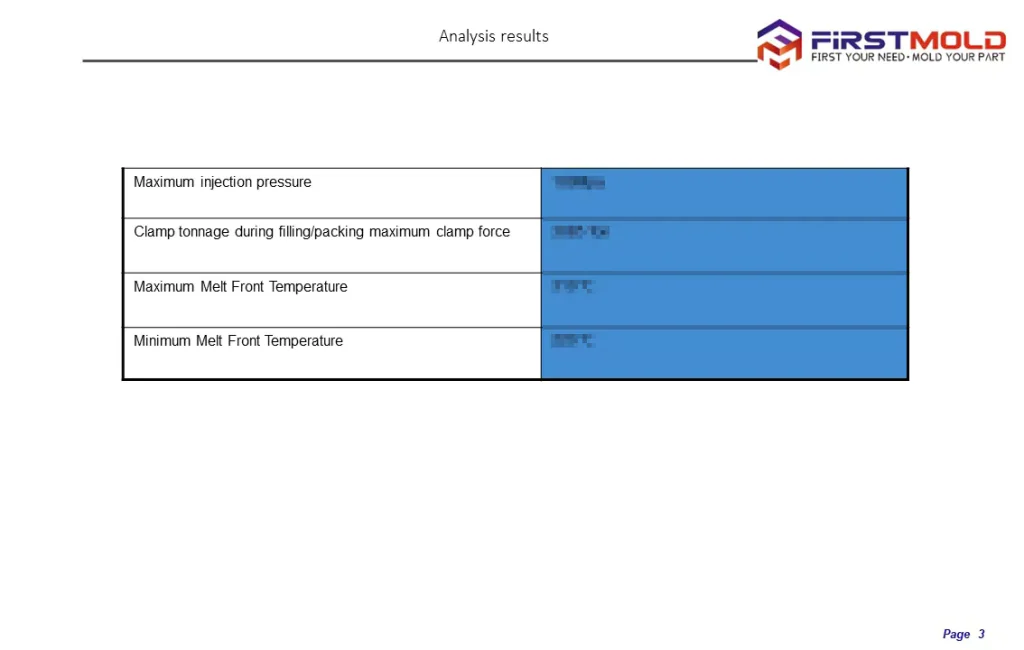
A mold flow analysis report begins by presenting essential basic information. This includes important details such as the project number, resin material, part number, cavity, date, and the specific version of the mold flow software used (Mold Flow REV). Additionally, the report includes the name of the company conducting the analysis, the analyzer responsible for the study, the simulated material properties, and key parameters like melt temperature, mold temperature, and fill control settings.
The project area, another crucial piece of information, helps define the scope of the analysis and provides context for evaluating the results. This area may encompass the entire part or focus on specific regions of interest, depending on the objectives of the analysis. By clearly defining the project area, the mold flow analysis report ensures that the simulation accurately represents the intended conditions.
Key performance indicators are also documented in the report. These include the maximum injection pressure, which indicates the pressure required to fill the mold cavities completely. The clamping tonnage, another important parameter, represents the force exerted by the mold clamping system to keep the mold closed during injection. Maximum and minimum melt front temperatures provide insights into the thermal behavior of the material during filling.
By including these details in the mold flow analysis report, stakeholders can comprehensively understand the project and the specific conditions under which the analysis was conducted. This transparency ensures that the analysis results can be properly interpreted and effectively utilized for decision-making in the tooling process.
Material Data
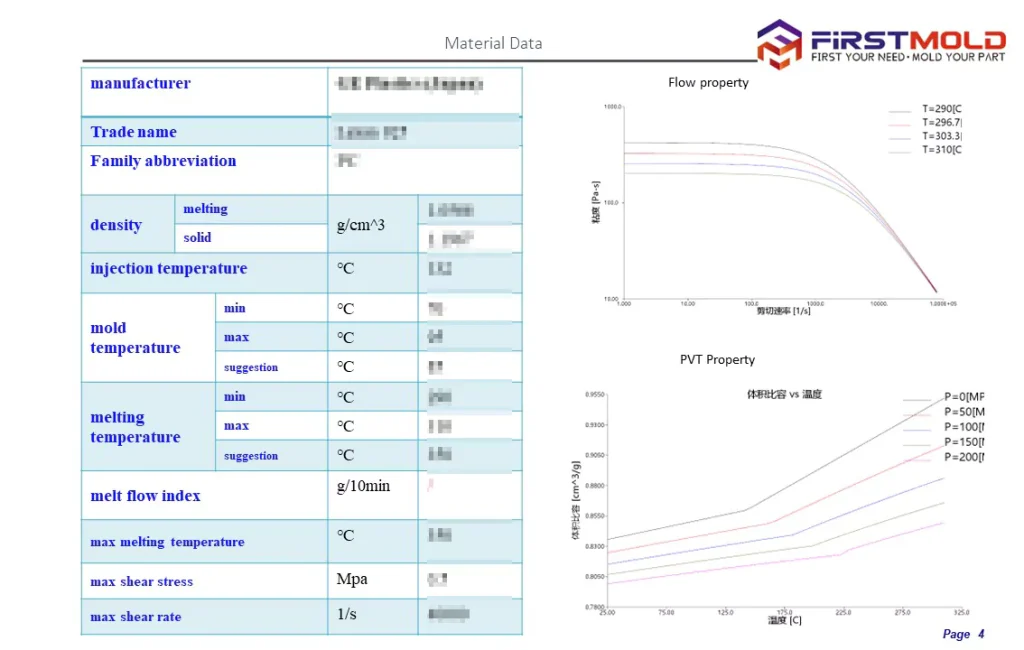
The material data section in a mold flow analysis report includes important information about the resin being analyzed. This includes density, mold temperature, melting temperature, and melt flow index.
Mesh thickness diagnosis
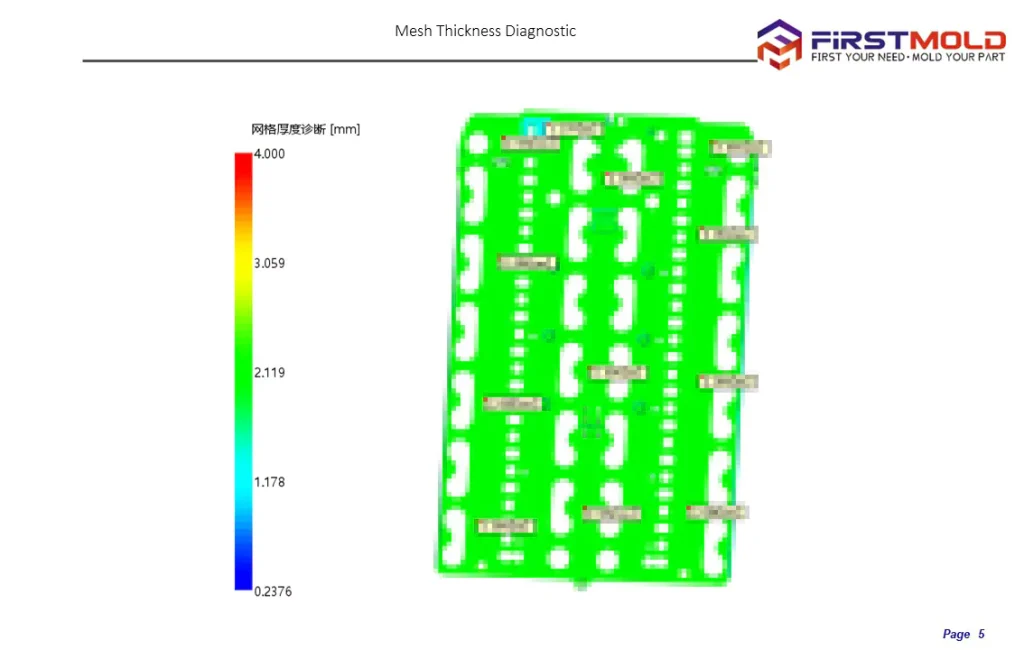
Mesh thickness diagnosis is an important aspect of mold flow analysis. It involves evaluating the thickness of the mesh elements used to simulate the geometry of the part and mold in the analysis. The purpose of mesh thickness diagnosis is to ensure an appropriate level of mesh refinement, balancing accuracy with computational efficiency.
Analysts can identify areas where the mesh elements are either too thick or too thin by analyzing the mesh thickness. Thick elements can result in inaccurate results, while thin elements may lead to excessive computational time or even simulation failure. Adjusting the mesh thickness helps achieve a balance between accuracy and computational efficiency.
This is crucial for obtaining reliable results in mold flow analysis. It allows analysts to refine the mesh in critical areas, such as complex geometries or regions with high flow or temperature gradients. The simulation can accurately capture the flow behavior, pressure distribution, cooling characteristics, and other important factors that impact the injection molding process by optimizing the mesh thickness.
Initial gate locations and sizes
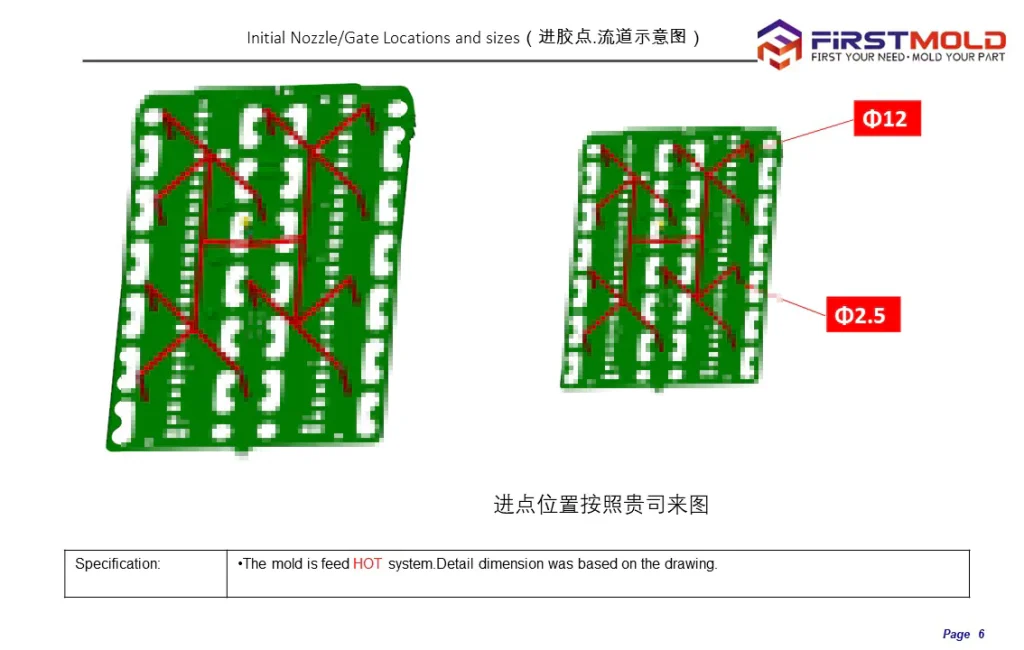
Analysts evaluate various factors to determine the optimal gate locations and sizes. These factors include:
Filling Pattern:
Manufacturers should choose the gate locations to promote balanced and uniform mold cavity filling. This ensures that the molten plastic reaches all areas of the part consistently, minimizing potential defects like flow hesitation, weld lines, or air traps.
Pressure and Velocity Distribution:
The gate locations and sizes affect the pressure and velocity distribution within the mold. Proper gate selection helps maintain an appropriate pressure profile, preventing excessive pressure drop or shear stress, which can lead to issues such as part warpage, and 沉痕.
Cooling Efficiency:
Gate locations should consider the cooling requirements of the part. Placing gates in areas that promote effective cooling can help achieve shorter cycle times and enhance overall productivity. It also helps minimize the potential for heat-related defects like sink marks or part distortion.
Moldability and Manufacturability:
Gate locations and sizes should align with the design and manufacturing constraints of the mold. Factors such as mold complexity, tooling limitations, and part geometry influence the selection of gate locations and sizes. The goal is to balance moldability, part quality, and ease of manufacturing.
Through mold flow analysis, analysts can virtually evaluate different gate locations and sizes, simulating the flow behavior and assessing the impact on key parameters such as fill time, pressure distribution, shear rate, and cooling efficiency. This analysis provides valuable insights for making informed decisions and optimizing the gate design before moving forward with the actual mold production.
Customers often have specific requirements or preferences for gate locations and sizes in their molded parts. These specifications can be based on the desired appearance, functionality, or manufacturing considerations. When conducting mold flow analysis, it is essential to consider these customer-specified gate locations and sizes to ensure that the analysis aligns with their expectations.
Filling Time
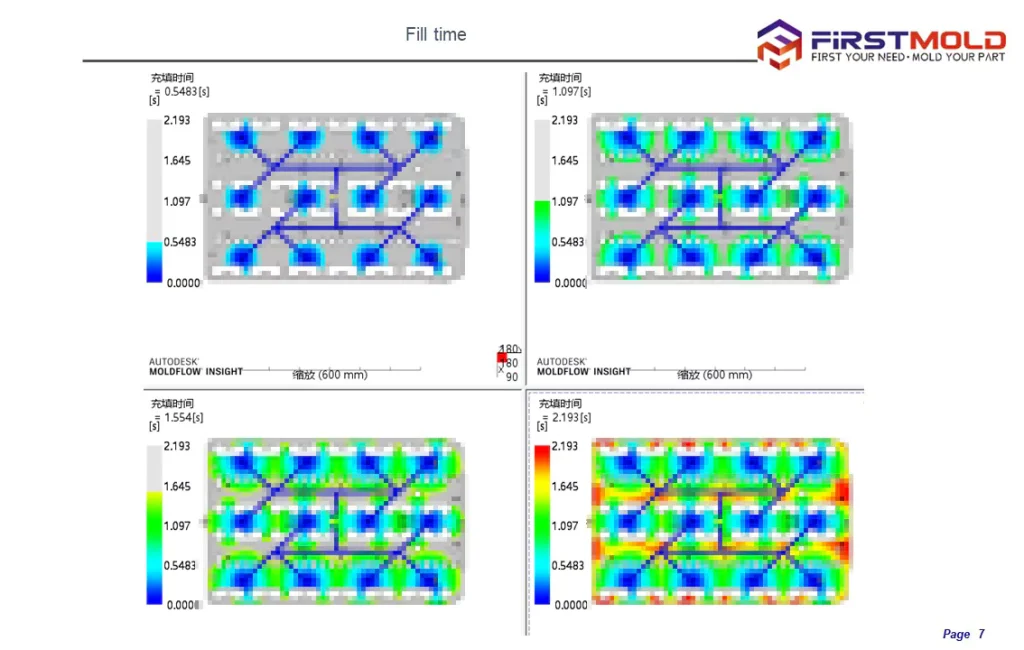
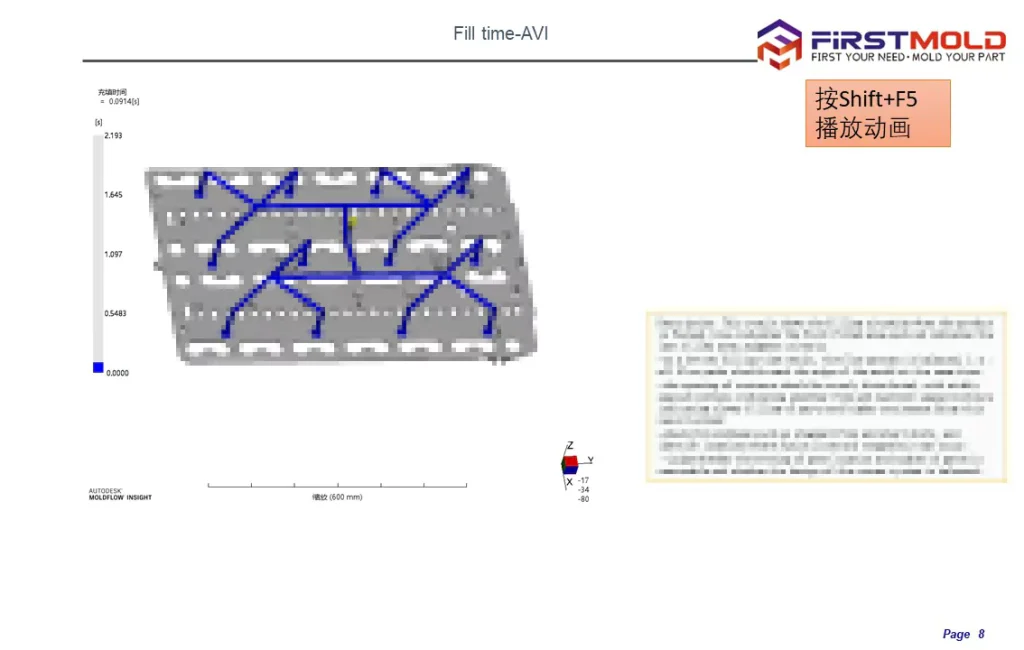
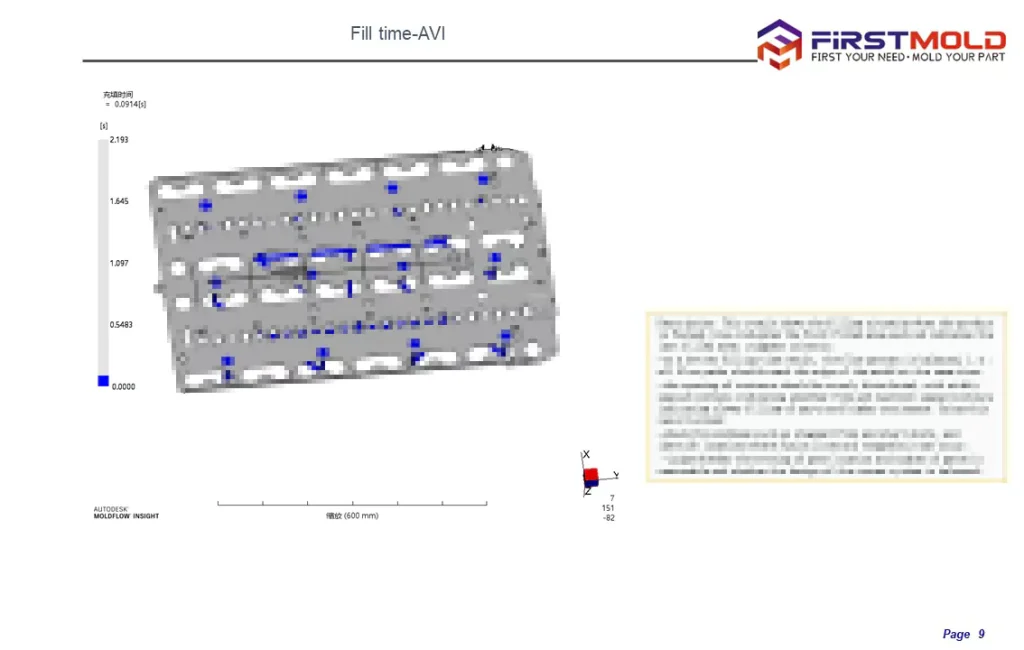
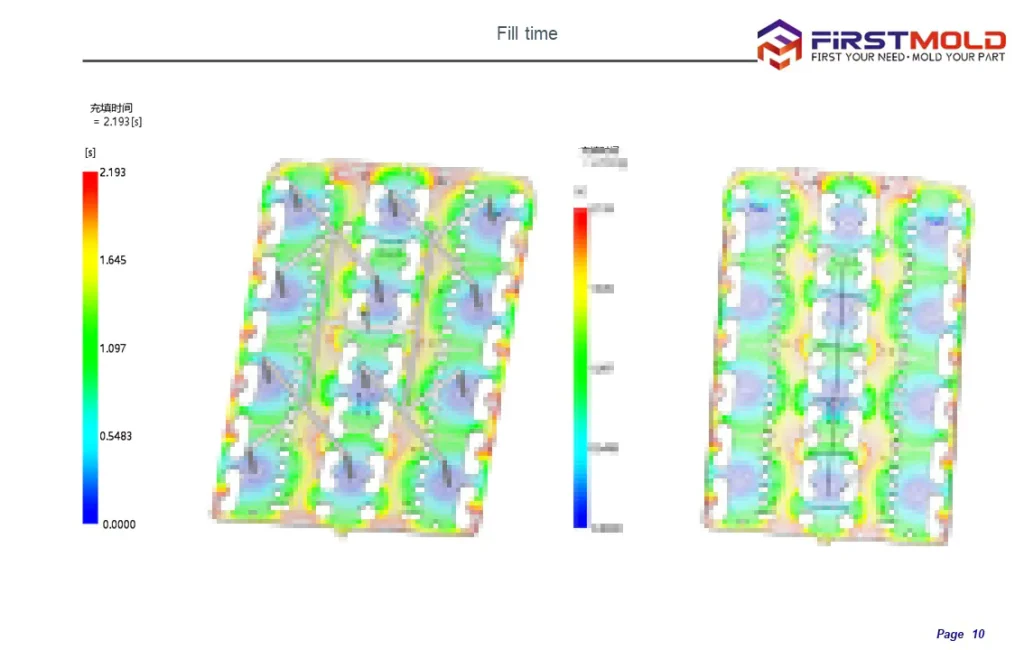
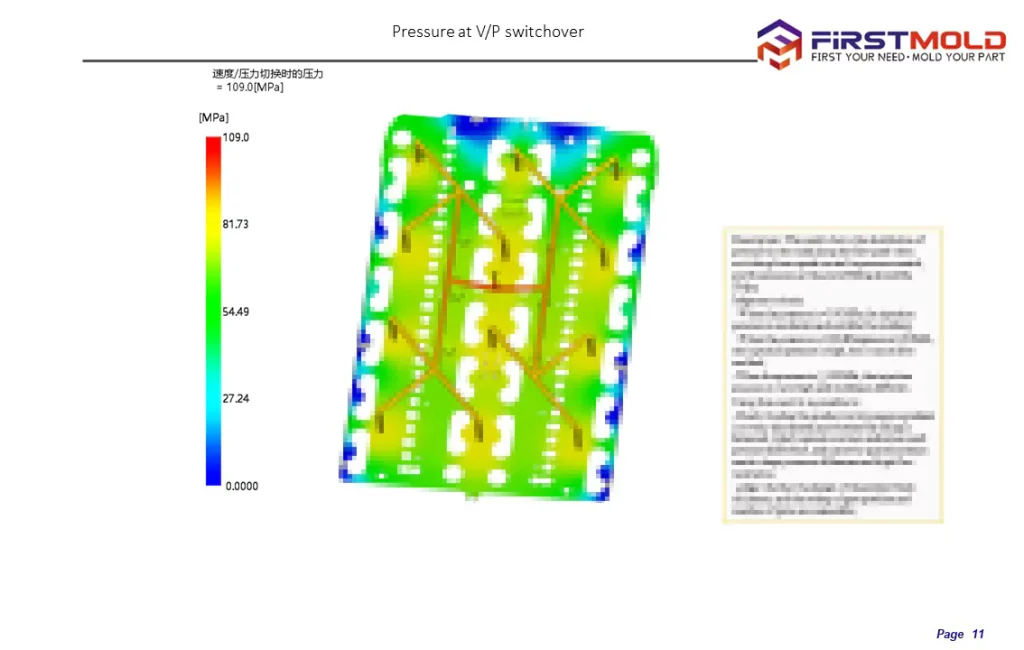
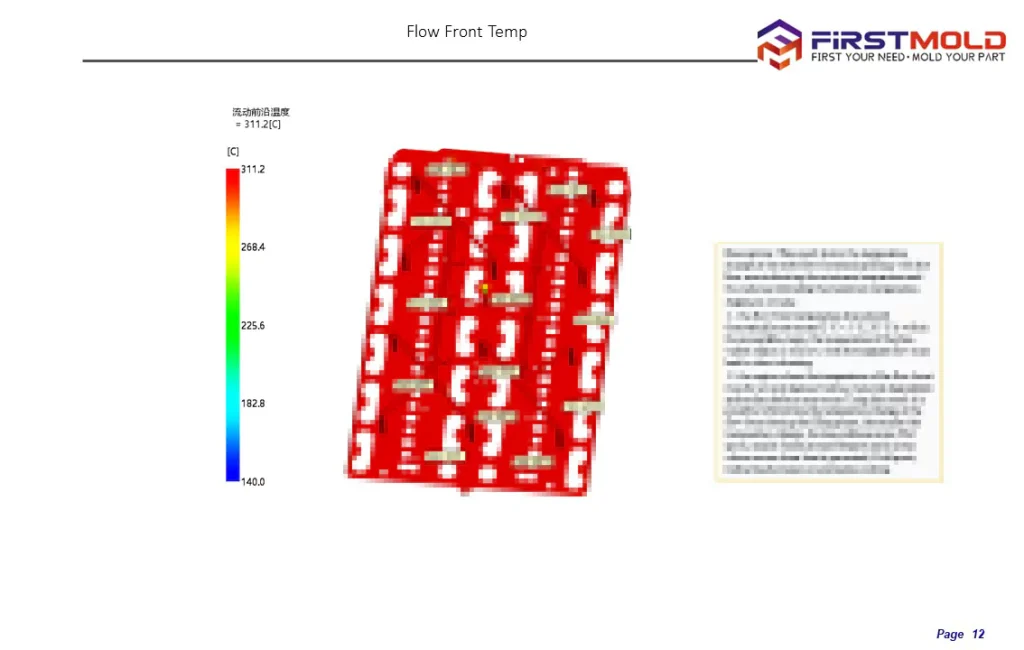
The mold filling time does show the expansion of the melt flow front, typically presented as a shaded graph. However, the statement regarding using a cloud pattern plot is incorrect. The mold filling time is not typically displayed using a cloud plot with contour lines.
The mold filling time is indeed an important and critical result in most mold flow analyses. It provides information about the flow behavior of the melt throughout the cavity and helps identify potential issues in the injection molding process.
A balanced filling process is indicated when the melt reaches all remote parts of the cavity at essentially the same moment. This signifies uniform filling and reduces the likelihood of defects or inconsistencies in the molded part.
The mold filling time results can help identify problems such as 短枪 and hesitations. Short shots occur when insufficient material fills a certain area, resulting in a gray or incomplete region in the analysis. Conversely, dense contours in a small area indicate hesitations, suggesting a potential flow interruption or inconsistency that can lead to a short shot.
Overpacking is another issue that can be identified through mold filling time analysis. If excessive melt is present in a specific flow path during the initial cavity filling, it may lead to overpacking. Overpacking can cause uneven density distribution, exceed the desired weight of the product, waste material, and even contribute to warpage issues.
Nozzle Pressure
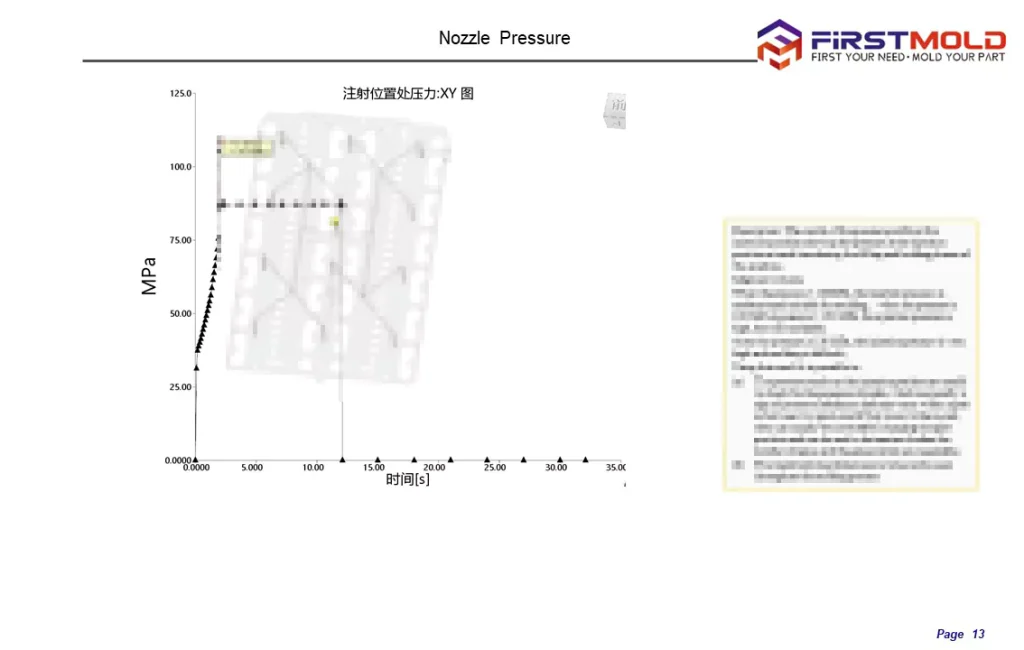
During mold flow analysis, the software calculates and visualizes the distribution of nozzle pressure throughout the mold cavity. This information helps in evaluating the filling behavior, identifying potential issues, and optimizing the molding process.
The analysis of nozzle pressure in mold flow analysis serves several purposes:
Filling Behavior:
Nozzle pressure data helps understand how the melt material flows and fills the mold cavity. It provides insights into the flow front progression, flow patterns, and any variations in pressure distribution.
Part Quality:
By analyzing the nozzle pressure, it is possible to assess the impact on part quality. Uneven nozzle pressure distribution can lead to inconsistencies in the filling, such as flow imbalances, weld lines, or air entrapment, which may affect the final part’s properties.
Gate Design and Sizing:
Nozzle pressure analysis helps evaluate the suitability of gate locations and sizes. It assists in determining the optimal gate dimensions to ensure proper material flow and minimize potential issues such as high-pressure drops or flow restrictions.
Process Optimization:
Nozzle pressure analysis allows for the identification of potential process optimization opportunities. It helps adjust process parameters, such as injection speed or melt temperature, to achieve more uniform nozzle pressure distribution and improve overall molding efficiency.
The XY plot of the clamping force
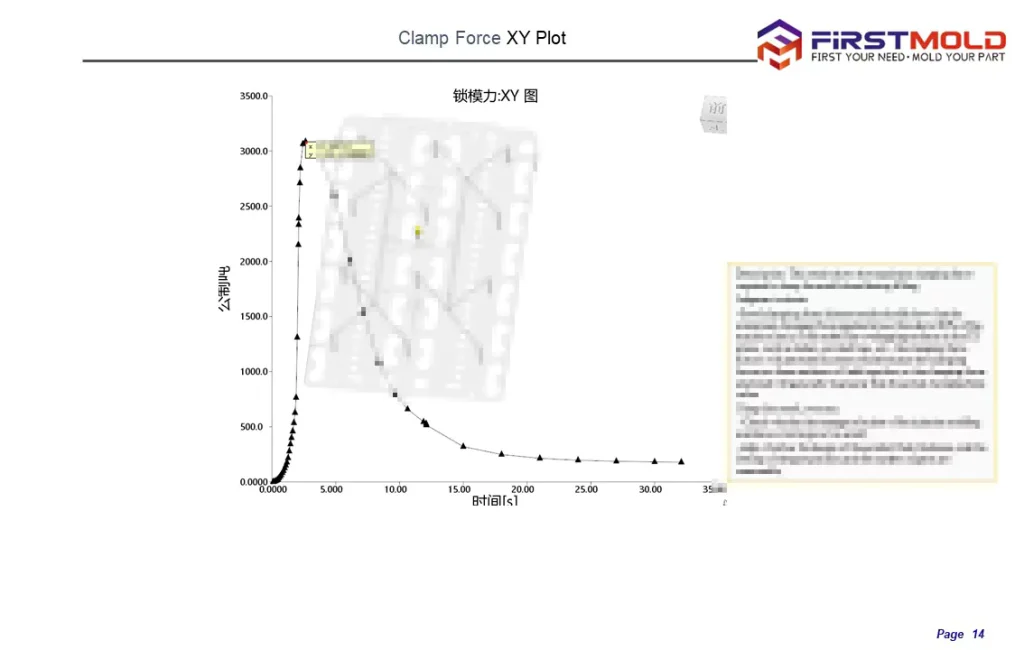
The XY plot of clamping force in mold flow analysis displays the clamping force variation over time. The clamping force is influenced by factors such as the balance of mold filling, holding pressure, and the transition time for volume/pressure control. Even small adjustments to these parameters can lead to significant changes in clamping force.
Ensuring that the maximum clamping force does not exceed the maximum clamping force capacity of the injection molding machine used for producing the part is crucial. Exceeding the machine’s clamping force limit can result in potential equipment damage or compromised part quality.
By analyzing the clamping force XY plot, manufacturers can assess and optimize the mold design and process parameters to maintain the clamping force within safe and efficient limits. This helps ensure successful and reliable injection molding operations, preventing any adverse effects on the final product and the injection molding machine itself.
Air Traps
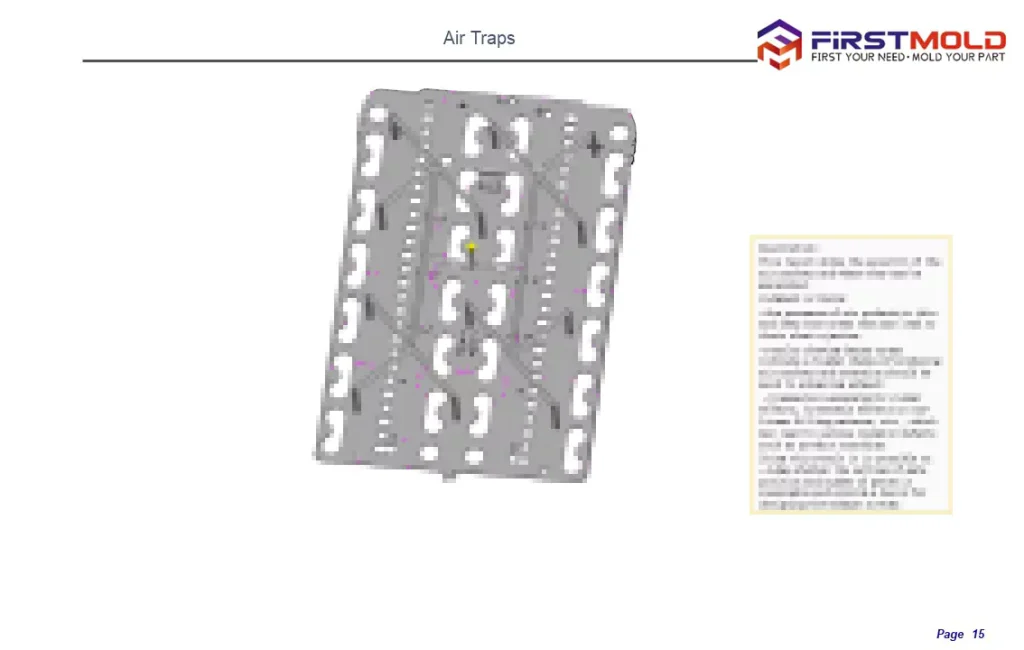
The air traps occur when material flow converges from multiple directions and gets trapped by air pockets within the mold cavity. The mold flow analysis results accurately identify and display these air traps.
When air traps are located on the parting surface of the mold, it is important to ensure proper gas exhaust to prevent trapped air from causing defects in the molded part. We achieve this by incorporating exhaust slots or vents in the mold design at the locations where air traps are present.
To eliminate air traps, it is necessary to address the areas where air pockets are formed. Modifying the product’s wall thickness, adjusting the sprue position, and optimizing the injection time can help alleviate air trapping issues and improve the overall part quality. By making these adjustments, the flow of material can be optimized, reducing the likelihood of air traps and improving the filling and packing of the mold cavity.
Weld Lines
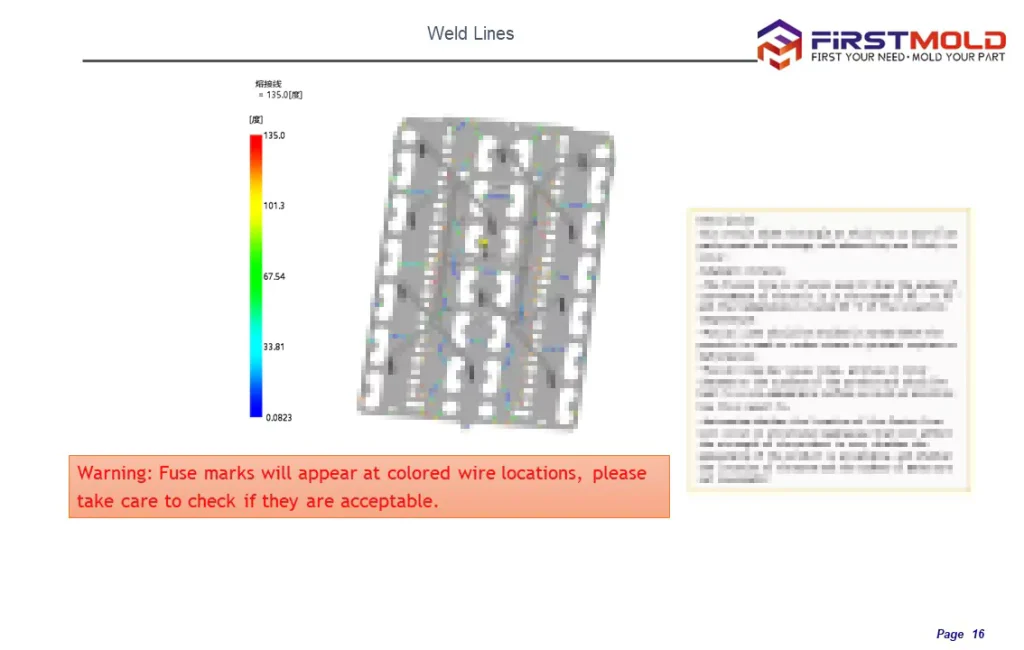
The weld lines are created when two melt flow fronts converge or when a flow front separates and recombines, typically occurring when the melt flows through a hole or encounters significant flow rate variations. In cases where there is a notable discrepancy in flow rates, weld lines can also form, such as when thicker sections experience faster flow while thinner sections have slower flow, resulting in a weld line at the junction of the two.
Weld lines can be visualized in the mold flow analysis along with the mold filling time, temperature, and pressure graphs. Observing these results can identify the presence and location of weld lines. Reducing the number of injection gates to address weld lines can help eliminate some of them. Additionally, modifying the gate positions or adjusting the product’s wall thickness can alter the weld lines’ positioning.
Managing weld lines is crucial in injection molding, as they can affect the strength and aesthetics of the final product. By optimizing the mold design and process parameters, manufacturers can minimize the occurrence and impact of weld lines, resulting in higher quality and more visually appealing molded parts.
Plastic Shrinkage Volume and Shrinkage Estimation
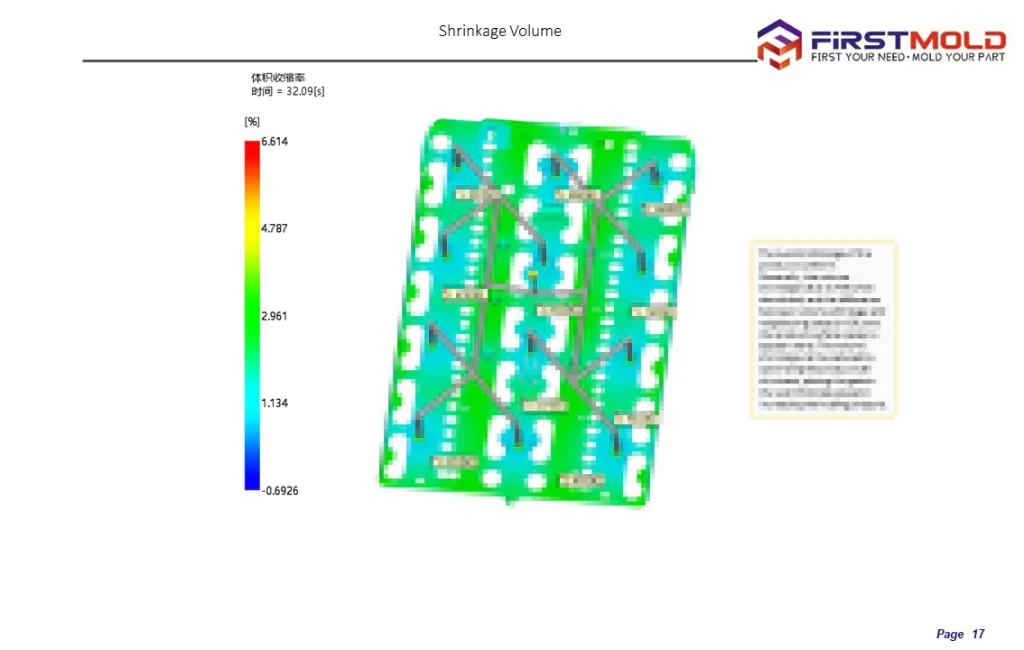
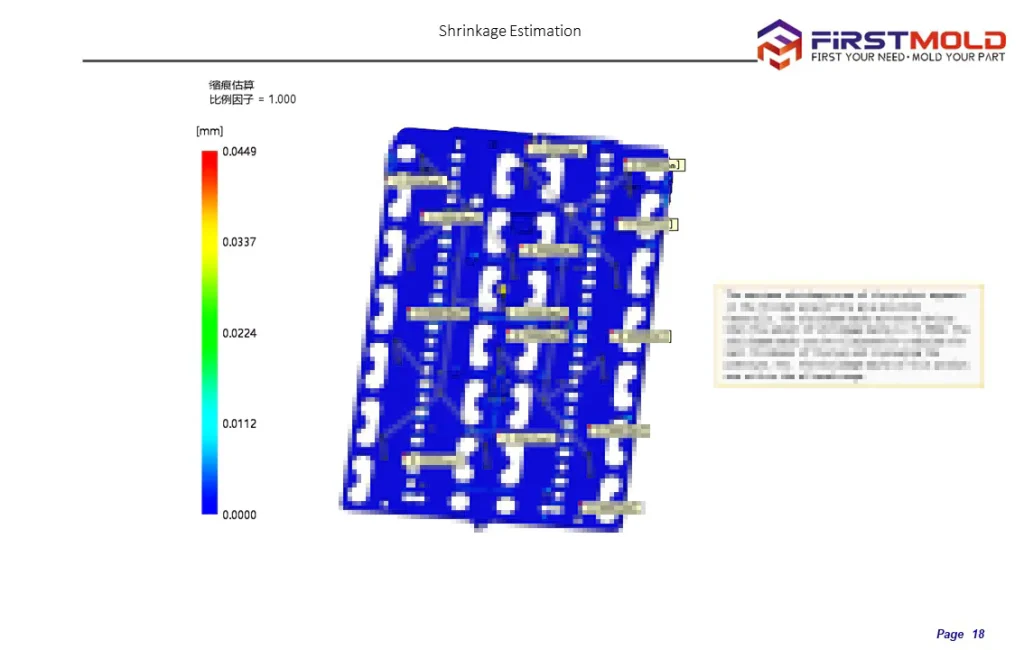
Volumetric shrinkage, sometimes called shrinkage volume because of the translation, refers to the reduction in the volume of a part caused by holding pressure during the molding process. It is typically expressed as a percentage. Volumetric shrinkage serves as an intermediate result that indicates the change in shrinkage of the product during the holding and cooling stages. Nevertheless, it is crucial to acknowledge that the volumetric shrinkage at ejection is regarded as the ultimate volume reduction of the part.
In practice, a specific data set derives the volumetric shrinkage at ejection. While the shrinkage should be uniform throughout the cavity, achieving perfect uniformity can be challenging. Adjustments to the holding curve can help enhance the uniformity of shrinkage, improving the overall quality of the molded part.
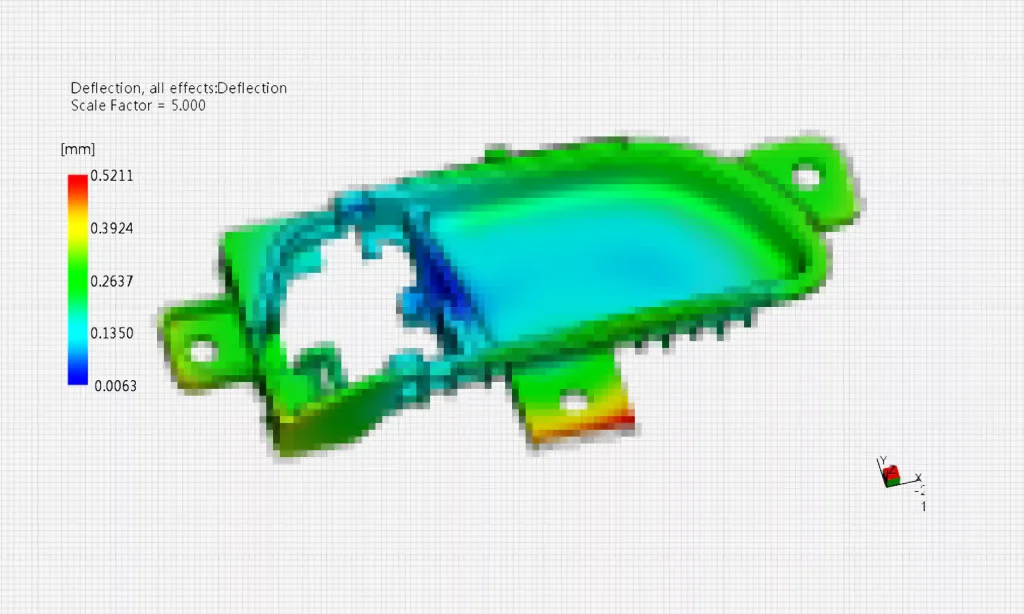
Deflection
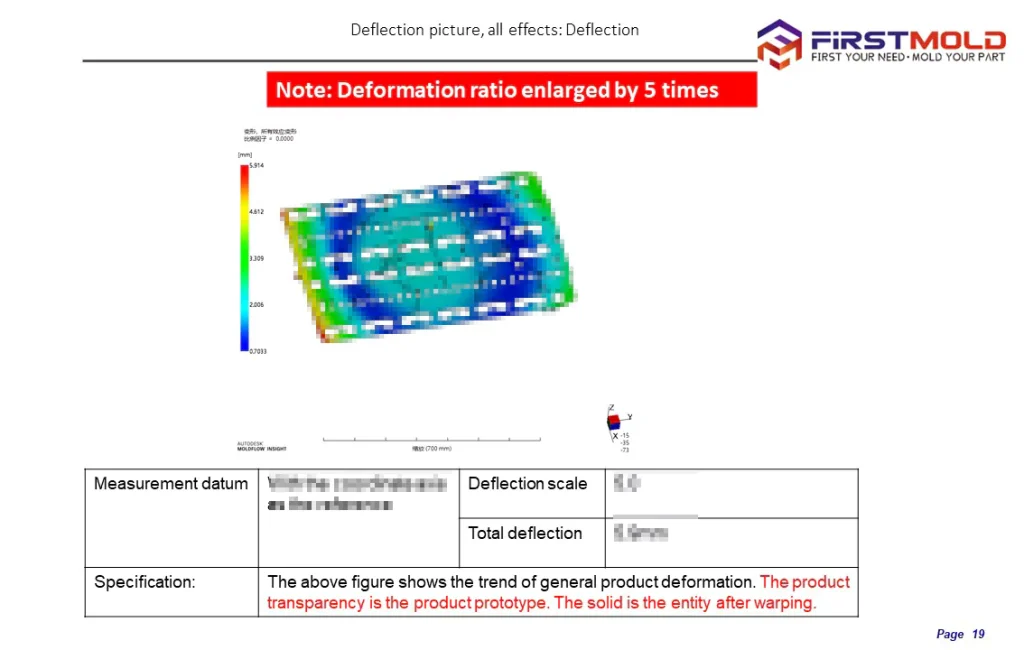
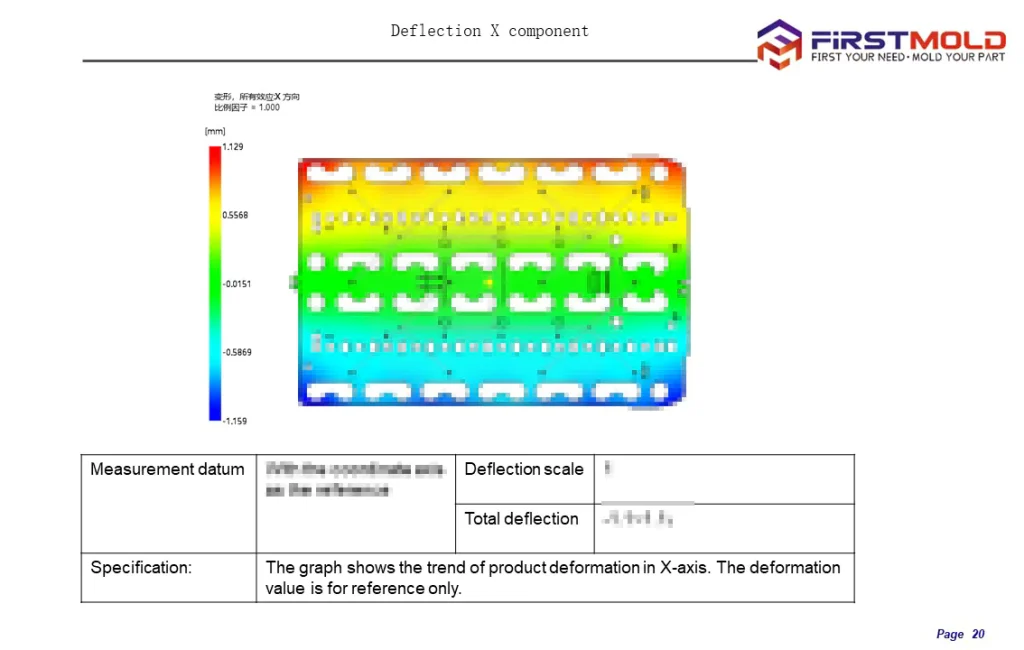
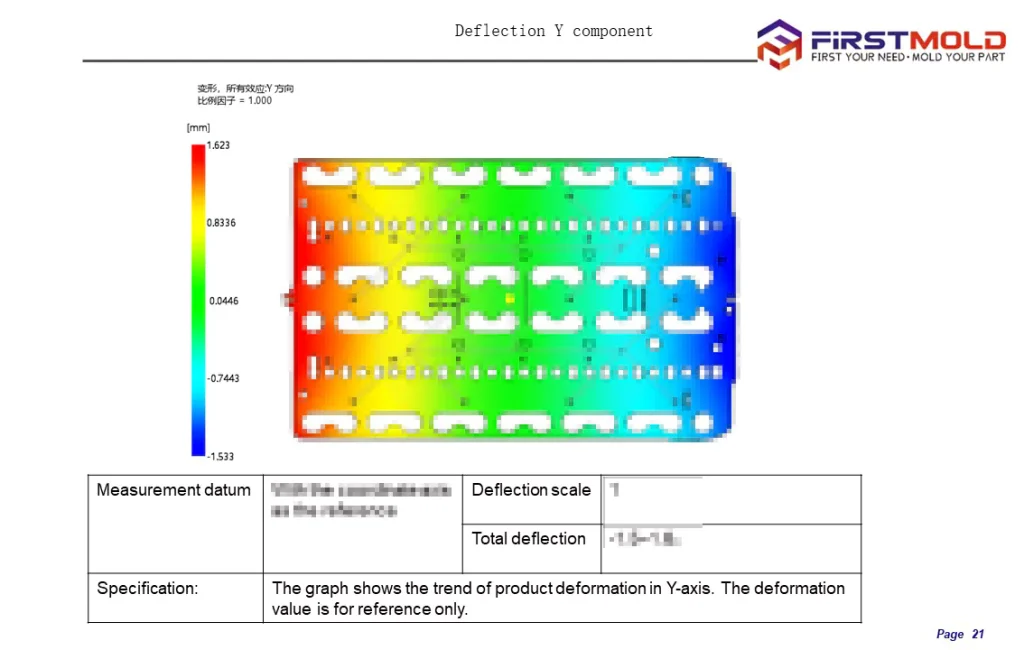
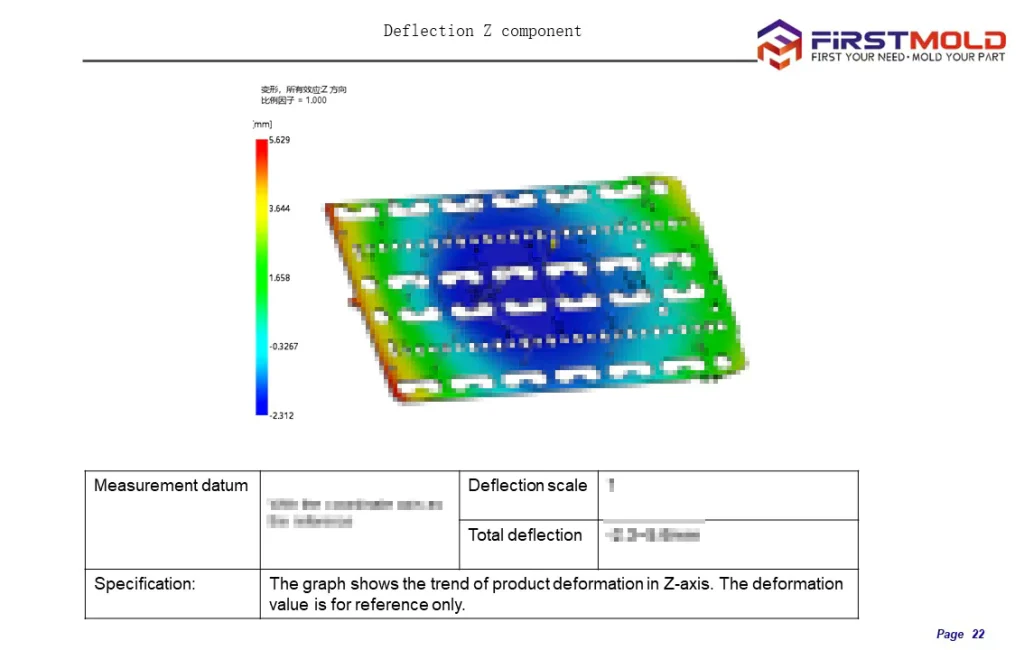
Various factors, including cooling, shrinkage, molecular orientation, and other mechanical properties of the material, can influence the deflection of a part.
Deflection due to cooling factors refers to the deformation during the plastic material’s cooling and solidification phase. Rapid cooling can lead to differential cooling rates, resulting in uneven shrinkage and potential warpage.
The inherent shrinkage of the material causes deflection due to shrinkage factors as it transitions from a molten state to a solid state. Shrinkage can cause the part to deform and result in dimensional changes.
Deflection due to molecular orientation occurs when the polymer chains align in a particular direction during the injection molding process. This molecular alignment can influence the mechanical properties and shape of the part, leading to deflection.
Overall deflection refers to the total deformation of the part, considering all contributing factors. In contrast, the deflection components in X, Y, and Z directions represent the specific deformation in each axis.
Taking into account all these factors during the analysis of part deflection in mold flow analysis is crucial to ensure precise predictions and effectively address any potential concerns related to warpage or dimensional stability.
Assessment and Feedback
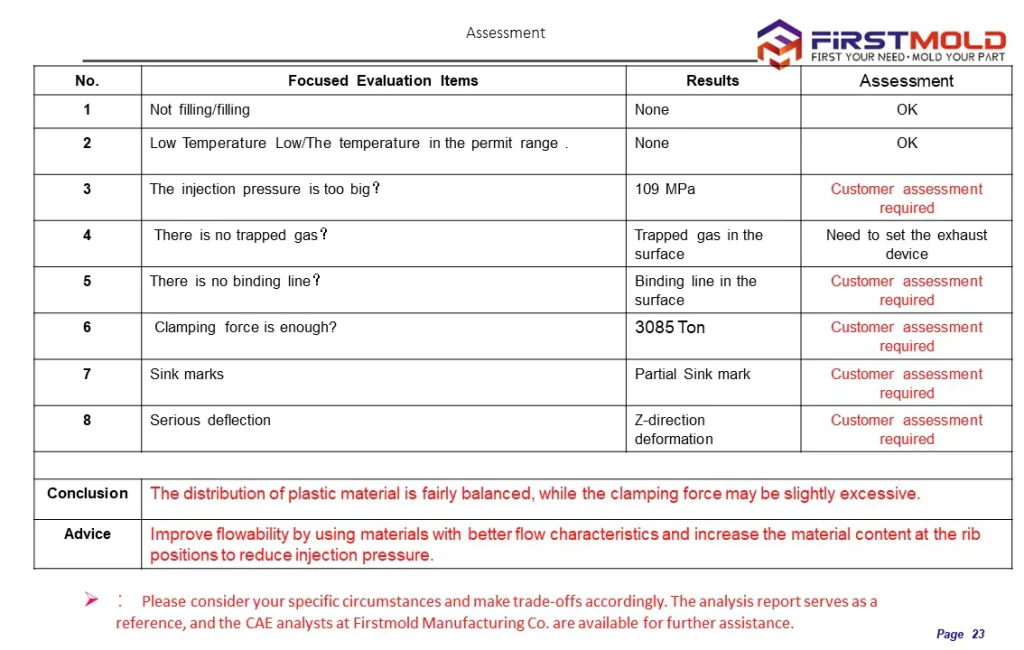
The assessment in mold flow analysis typically involves a comprehensive review of various factors and potential issues related to the injection molding process and part quality.
Some common evaluation items in mold flow analysis include:
Filling analysis:
Assessing the filling pattern and ensuring complete filling of the mold cavity without any short shots or flow hesitation.
Cooling analysis:
Evaluating the cooling efficiency and identifying potential cooling-related issues such as hot spots, uneven cooling, or long cooling times.
Deflection analysis:
Analyzing the potential for part Deflection or distortion due to material shrinkage, cooling, or structural factors.
Weld lines and air traps analysis:
Identifying the presence of weld lines and air traps and evaluating their potential impact on part strength, appearance, and functionality.
Pressure and temperature analysis:
Assessing the injection pressure and melt front temperature to ensure they are within acceptable ranges for the chosen material and process conditions.
Clamping force analysis:
Verifying that the calculated clamping force required to hold the mold closed during injection is within the capabilities of the injection molding machine.
Sink marks analysis:
Identifying areas of potential sink marks or surface depressions caused by non-uniform cooling or material shrinkage.
Gate location analysis:
Evaluating the gate locations and sizes to optimize the filling pattern, minimize weld lines, and achieve balanced filling.
Material flow analysis:
Assessing the material’s flow behavior throughout the mold cavity to ensure uniform filling and avoid issues like jetting or flow imbalance.
Shrinkage and dimensional analysis:
Analyzing the material shrinkage and predicting the potential dimensional changes of the part after molding.
These examples merely touch upon a fraction of the evaluation criteria encompassed in a comprehensive mold flow analysis. The specific evaluation criteria may vary depending on the project requirements, part complexity, and desired quality standards.
Summary of the mold flow analysis project
The above content represents a complete overview of the mold flow analysis report. It is crucial to highlight that the data analysis performed in a mold flow analysis report can vary depending on the specific product under analysis. Generally, the analysis will encompass the following aspects:
Filling Analysis:
- Filling time
- Weld lines
- Air traps
- The temperature at the flow front
Holding Analysis:
- Frozen layer fraction
- Pressure at injection location (XY Plot)
- Volumetric shrinkage
- Sink index
- Clamp force (XY Plot)
Deflection Analysis:
- Temperature distribution in the part
- Temperature difference within the part
结论
While I hold a positive stance towards mold flow analysis, the reality of its implementation in actual production often uncovers certain shortcomings and unexpected outcomes. Acknowledging this, I am determined to delve deeper into the subject and share my personal insights, views, and opinions on mold flow analysis. I am Lee Young from FirstMold. In the near future, I anticipate publishing content dedicated to this fascinating topic, and I invite you to stay connected and follow along if you share a similar interest. Together, let us explore the intricacies of mold flow analysis and unlock its potential for improved manufacturing processes.


